Code Coverage for iOS (Xcode 7)
Create code coverage reports for iOS unit tests using new Xcode 7 code coverage feature.
The Old Way
I’ll start with back reference to another post I wrote earlier, which describes the process of getting code coverage reports using good old gcov.
To try out the old approach checkout this repository and run the scripts.
# Run tests with gcov instrumentation.
./test-gcov.sh

# Generate Cobertura coverage report (output is gcov-report.xml).
./gcovr.sh

# Generate HTML report (output is lcov-reports).
./lcov.sh
There’s nothing new inside those scripts, same stuff as described in the previous blog post. Run these with Xcode 6 and make sure that everything works almost as expected.
Don’t worry if you already trashed Xcode 6 and switched to Xcode 7. You still can run all the same scripts. The only problem is that lcov.sh will fail, that’s not critical but is a first sign of trouble.
The real problem is that there’s no coverage information available for Swift code. That’s because there are no gcda and gcno files generated for Swift.
# For Model.swift
Model.d
Model.dia
Model.o
Model.swiftdeps

# For XCTestCase+GCovFlush.m
XCTestCase+GCovFlush.d
XCTestCase+GCovFlush.dia
XCTestCase+GCovFlush.gcda
XCTestCase+GCovFlush.gcno
XCTestCase+GCovFlush.o
So Apple is slowly deprecating gcov after all.
Profile Data
What should we use to get test coverage reports for Swift code?
Apple is switching to a new Coverage Mapping Format and Profile Data format.
LLVM toolset comes with a number of tools to work with profile data format, specifically llvm-cov. This tool can analyze profile data and instrumented app binary and emit code coverage data in more human-friendly format. But first we need to get profile data generated and app binary instrumented.
Gather Profile Data
With Xcode 7 it’s a much easier task. Instead of specifying 3 build settings xcodebuild now has a single flag called -enableCodeCoverage and all you have to do is set it to YES.
xcodebuild test \
    -project MixAndMatchTests.xcodeproj\
    -scheme MixAndMatchTests \
    -sdk iphonesimulator \
    -configuration Debug \
    -enableCodeCoverage YES
The test-profdata.sh from GitHub repository is more detailed version of the script below. Feel free to just run ./test-profdata.sh.
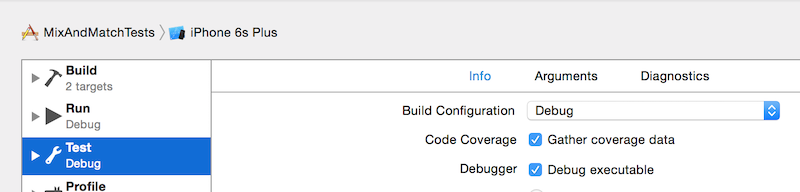
Setting -enableCodeCoverage flag to YES is essentially the same as checking the “Gather coverage data” checkbox in Xcode scheme settings.
Convert Profile Data
OK, so now profile data is generated and we have an instrumented binary available at out disposal. The question is where do we find the binary and profile data?
Both instrumented binary and profile data are sitting inside derived data directory. We can get derived data path from build settings.
BUILD_SETTINGS=build-settings.txt

# Get build settings
xcodebuild -project MixAndMatchTests.xcodeproj \
    -scheme MixAndMatchTests \
    -sdk iphonesimulator \
    -configuration Debug \
    -showBuildSettings > ${BUILD_SETTINGS}

# Project Temp Root ends up with /Build/Intermediates/
PROJECT_TEMP_ROOT=$(grep -m1 PROJECT_TEMP_ROOT ${BUILD_SETTINGS} | cut -d= -f2 | xargs)
Let’s look for profile data first. From Apple forums we know that we are looking for Coverage.profdata file, so let’s just find it.
PROFDATA=$(find ${PROJECT_TEMP_ROOT} -name "Coverage.profdata")
Looking for binary is similar, we use the fact that it’s sitting inside app bundle, e.g. MixAndMatchTests.app/MixAndMatchTests.
BINARY=$(find ${PROJECT_TEMP_ROOT} -path "*MixAndMatchTests.app/MixAndMatchTests")
Note: You shouldn’t use -derivedDataPath or CONFIGURATION_BUILD_DIR option when running xcodebuild for testing. Having build directory and derived data directory in custom locations will cause some problems for open source tools which I’ll talk later in this article.
OK, so we got both path to binary and path to profile data, let’s feed those to llvm-cov now.
xcrun llvm-cov show \
    -instr-profile ${PROFDATA} \
    ${BINARY}
What you see now is a detailed coverage data. To get a short summary, let’s use report option instead of show.
xcrun llvm-cov report \
    -instr-profile ${PROFDATA} \
    ${BINARY}

# Output
Filename                    Regions    Miss   Cover Functions  Executed
-----------------------------------------------------------------------
...usr/include/MacTypes.h         0       0    nan%         0      nan%
...sr/include/objc/objc.h         0       0    nan%         0      nan%
...r/include/sys/_types.h         0       0    nan%         0      nan%
...tchTests/AppDelegate.m        17       6  64.71%         7    42.86%
...DetailViewController.m         8       8   0.00%         4     0.00%
...MasterViewController.m        30      25  16.67%        10    40.00%
...MatchTests/Model.swift         1       0 100.00%         1   100.00%
...MatchTests/ObjCModel.m         1       0 100.00%         1   100.00%
...ixAndMatchTests/main.m         3       0 100.00%         1   100.00%
-----------------------------------------------------------------------
TOTAL                            60      39  35.00%        24    41.67%
Yes! A nice colorized (at least for me) output! Check llvm-cov-show.sh script for a cleaner version of the shell script.
For now please ignore the fact that some system and test files are included in report, we will filter them out later. In the meantime we have achieved our first goal and converted profile data into some kind of test coverage report.
GCov Report
So we have a coverage report, but how useful is it? Well, it’s not much useful as it is.
The main reason for generating coverage report is to be able to feed it to your favorite CI server and enjoy a nicely formatted and browsable version of it. Ever more, configure your build jobs to be marked as stable, unstable or failed if test coverage is below a certain threshold.
As it happens, none of the popular CI servers seem to have plugins for parsing Profile Data yet. So we have to convert it to something that CI servers can digest, such as Cobertura coverage report.
LLVM toolset doesn’t support such conversion, but there is a glimpse of hope.
A brief search lead me to this Stack Overflow page with further reference to Slather ruby gem. Slather is designed to take care of all your testing tasks including generating coverage report. In this article I’ll only use it for converting profile data to Cobertura format.
There is a pull request #92 (still open at the moment of updating this post) with changes to support this new feature. Let’s build this gem from source and see if it’s up to job.
First we need to create a custom Gemfile.
# Gemfile.
source 'https://rubygems.org'
gem 'slather', :git => "https://github.com/viteinfinite/slather.git", :branch => "feature-profdata"
Then install Slather from this branch.
bundle install
And we are good to go.
bundle exec slather coverage \
    --input-format profdata \
    --cobertura-xml \
    --ignore "../**/*/Xcode*" \
    --output-directory slather-report \
    --scheme MixAndMatchTests \
    MixAndMatchTests.xcodeproj
Now check slather-report directory and you got your cobertura.xml file ready to be fed to CI server plugin! There are options other than --cobertura-xml, such as --simple-output, --html and others.
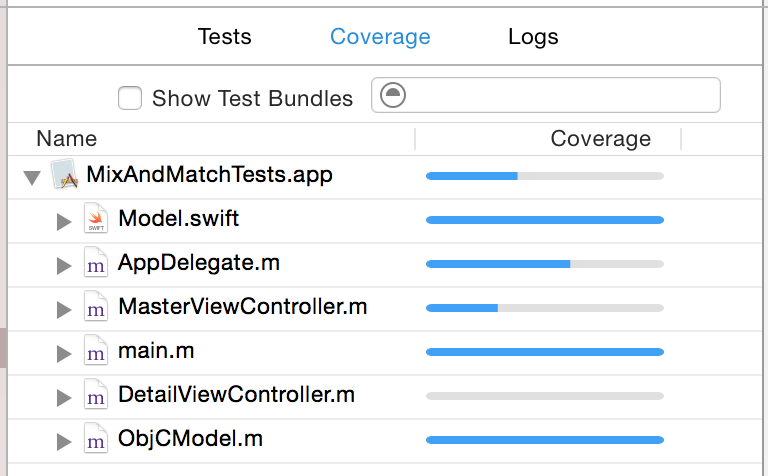
Let’s use simple output option and compare it to Xcode output.
MixAndMatchTests/AppDelegate.m: 16 of 33 lines (48.48%)
MixAndMatchTests/DetailViewController.m: 0 of 23 lines (0.00%)
MixAndMatchTests/MasterViewController.m: 19 of 63 lines (30.16%)
MixAndMatchTests/Model.swift: 3 of 3 lines (100.00%)
MixAndMatchTests/ObjCModel.m: 3 of 3 lines (100.00%)
MixAndMatchTests/main.m: 5 of 5 lines (100.00%)
Test Coverage: 35.38%
Fastlane
If you are a fan of fastlane (I am), then have a look at project Fastfile. It includes a basic example of how you can use scan and slather actions to get coverage reports.
Caveats
I’m adding this section as an update for this post. There’s a number of things you have to do to have proper coverage for Swift code.
Enable Testability
First of all enable testability for the main target. This is controlled by ENABLE_TESTABILITY build setting that has to be set to YES. In fact, enabling this flag for unit tests target causes no trouble. This flag will allow you to import Swift code from main target in unit tests code in this way:
@testable import MixAndMatchTests
Don’t include main target files to Unit Tests target
This is another mandatory step to get coverage for Swift code. Otherwise you will get a lot of warnings like this in the test log:
# For Swift files
objc[7995]: Class _TtC14MixAndMatchTests4Model is implemented in both
<derived-data-path>/MixAndMatchTests.app/MixAndMatchTests and
<derived-data-path>/MixAndMatchTests.xctest/MixAndMatchTests.
One of the two will be used. Which one is undefined.

# For Objective-C files
objc[7995]: Class ObjCModel is implemented in both
<derived-data-path>/MixAndMatchTests.app/MixAndMatchTests and
<derived-data-path>/MixAndMatchTests.xctest/MixAndMatchTests.
One of the two will be used. Which one is undefined.
This is not only annoying, but also will result in useless code coverage reports generated.
Don’t test Swift code using Objective-C code
This is rather a consequence of first two changes. Since Swift files are not part of test target, there is no generated code for these Swift files in the Swift umbrella header, and that means you can’t use this Swift code from Objective-C.
So you have to test Swift with Swift to get coverage reports.
Avoid using legacy and new coverage formats together
If you coverage results look totally off and you get tons of message in test log, that look like this:
ObjectiveC.gcda: cannot merge previous GCDA file: corrupt arc tag (<some hex address>)
Then you are most-likely mixing both test approaches together, which is not recommended.
Make sure you have disabled legacy flags GCC_GENERATE_TEST_COVERAGE_FILES and GCC_INSTRUMENT_PROGRAM_FLOW_ARCS, when you want to use Profile Data. Have a look at these discussions: 1, 2, 3.
Thanks to @GUL- for help with this tricky stuff.